Greenhouse gas balance 2022

Greenhouse gas balance 2022
The 2022 greenhouse gas balance is the first update of the balance since the publication of the climate protection concept. Total emissions in 2022 were 22,888 tonnes of CO2-equivalents.
Methodology and system limits
The scope of the 2022 GHG balance sheet comprised the following fields of action:
- Scope 1: Gas procurement, vehicle fleet (excluding upstream chains; excluding ships)
- Scope 2: Electricity procurement (taking into account the federal electricity mix)
- Scope 3:
- Upstream chains (building energy & vehicle fleet)
- Mobility (business trips, semesters abroad, everyday mobility)
- Procurement (IT, paper)
- Water consumption & waste water
The aim is to further develop and refine the data basis for greenhouse gas balancing in the future so that areas not previously taken into account (e.g. office furniture, overnight stays on business trips, etc.) can also be included in the balance sheet.
At this point, it should be noted that there is currently no standardised rule or regulation for universities and colleges, or for educational institutions in general, regarding the accounting of GHG emissions. Differences in the base years, system boundaries and application of the accounting standards must therefore be taken into account when comparing with other universities.

Total emissions 2022
The total emissions of Carl von Ossietzky University in 2022 amounted to 22,888 tonnes of CO2-equivalents. This means that emissions have increased by 1,510 tonnes of CO2-equivalents compared to the base year 2019. The increase in emissions is partly due to the commissioning of a new combined heat and power plant (CHP) at the Haarentor site in autumn 2021, as it is powered by natural gas. In addition, the emission factor for the federal electricity mix has deteriorated.

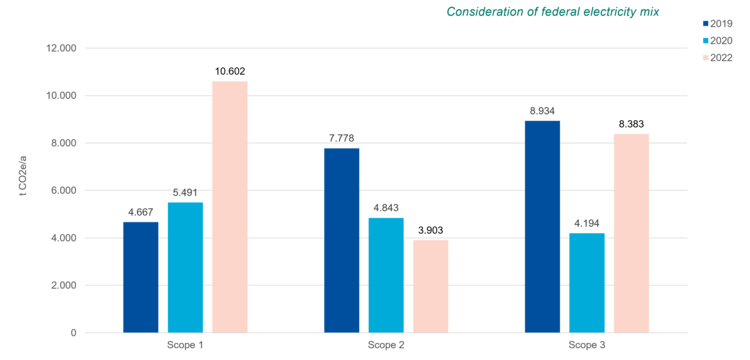
Development of emissions according to Scopes 1 to 3
Emissions have developed differently across the three scopes of the Greenhouse Gas Protocol. Due to the new CHP plant, emissions have risen sharply, particularly in Scope 1, and amounted to 10,602 tonnes of CO2-equivalents in 2022. At the same time, emissions in Scope 2 fell to 3,903 tonnes of CO2-equivalents. In Scope 3, emissions have remained at a similar level compared to 2019 at 8,383 tonnes of CO2-equivalents.
Breakdown by fields of action
Building energy accounts for the largest share of total emissions. A total of 16,898 tonnes of CO2-equivalents were produced here in 2022, based on the federal electricity mix. Taking green electricity products into account, this area of activity accounted for 12,538 tonnes of CO2-equivalents. This area therefore accounted for 73.83% of total emissions in 2022. The commissioning of the new CHP plant and the corresponding increase in emissions in this area of activity has also increased the importance of this area in the overall balance sheet.

Nevertheless, the area of mobility continues to be of great importance. A total of 4,470 tonnes of CO2-equivalents were caused by everyday mobility. That is 19.53% of total emissions. In addition, 1,111 tonnes of CO2-equivalents were caused by international mobility, such as business trips and the use of the vehicle fleet. Compared to the 2019/2020 GHG balance sheet, the values in the area of everyday mobility are now based on a comprehensive mobility survey of students and employees, which has significantly improved the data quality. Compared to 2019, the values in this area have fallen by 102 tonnes of CO2-equivalents In the area of business travel, emissions actually fell by 412 tonnes of CO2-equivalents to 700 tonnes of CO2-equivalents compared to 2019. However, this is presumably still primarily due to the impact of the pandemic, which continued to have a significant effect in 2022. There was a small GHG reduction of 7 tonnes of CO2-equivalents in the vehicle fleet area, meaning that this area accounted for a total of 37 tonnes of CO2-equivalents.

Dual Reporting 2022
The accounting standard of the GHG Protocol stipulates that emissions in Scope 2 must be presented according to two different approaches.
On the one hand, the localised approach applies, according to which the emissions from electricity procurement are to be determined taking into account the federal electricity mix. This is intended to equalise the regional differences in the electricity mix purchased in order to enable better comparability of the figures. This approach also makes it easier to visualise the effect of efficiency measures in electricity consumption on emissions. According to this approach, the university's total emissions are 22,888 tonnes of CO2-equivalents in 2022.
According to the market-based approach, it can be taken into account that the organisation already purchases green electricity from a green electricity contract. At this point, the guarantees of origin from the production of renewable energy from third parties can therefore be taken into account. The University of Oldenburg is integrated into a framework agreement for green electricity via the state of Lower Saxony. Accordingly, the emissions in the market-based approach for Scope 2 (= electricity procurement) are to be set at 0 tonnes of CO2-equivalents. The total emissions are then 18,528 tonnes of CO2-equivalents. This increases the share of the other areas of action in the total emissions.