Maps / Addresses
Maps / Addresses
The Openstreetmap content element (in the Plug-ins tab) can be used to insert a map into the website. The appearance of this map can be customised. It can contain one or more map markers, clicking on which opens a pop-up with further information. It is also possible to display tracks (GPS tracks) or vector shapes.
Video of the training course on maps with address markers, tracks and vector shapes
An online training course on maps/addresses showed how to integrate a dynamic map, format it and add address markers, tracks and vector shapes. You can watch the video here.
Note: The video is only available to members of the university.
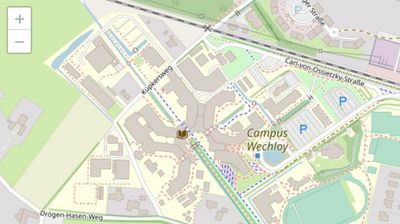
Select the map section to be displayed
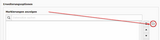
The positioning and zoom factor can now be changed, for example. This is done by selecting the desired map centre and the desired zoom level.
Here, building A12 and zoom level 18 have been selected on the map. (A higher zoom level corresponds to a more zoomed-in display).
Place markers on the map (from the data pool)
If you want to place markers on the map, you can either select existing university addresses or define your own marker positions if required.
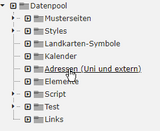
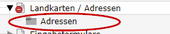
Firstly, we select two existing university buildings. This is done in the page tree in the "Data pool" under "Addresses (university and external)".


Note: When zooming out of the map, the markers move closer and closer together and are displayed bundled ("clustered") from a certain density. Such a cluster can be clicked on, making the individual markers in it individually clickable again.
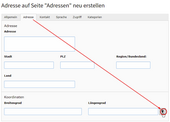
Define your own markers and place them on the map
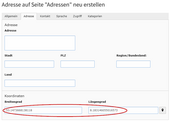
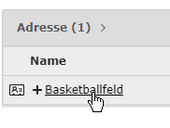
In addition to the centrally available addresses, you can also create and display your own. A marking requires at least a title (e.g. building name or similar) and map coordinates in order to be displayed. Additional data such as the full address can also be entered. The most important of this additional address data is then displayed in the pop-up window of the marker.


Categories can be used to group and colour map markers. Categories can be created where the corresponding addresses are maintained. To create a category, switch to the Web→List view in TYPO3. The desired marker symbol can be selected in the last settings tab for category editing. The available marker symbols can be found in the TYPO3 page tree in the Data pool→Map symbols folder. An address data record can then be assigned a desired category, allowing it to be shown and hidden together with the category using the level switch.
Here are the marker colours available for selection (additional motif markers could also be added here if required):


Integrate tracks (paths, routes)
GPS tracks, for example, can be displayed on the map to visualise certain routes. Similar to punctual map markers (addresses, "Points of Interest" (POI)), such paths are first defined as an element in TYPO3, for which a file in GPX format (GPS track) or KML (e.g. from Google Earth) can then be imported.
Display drawn vector paths (distances, points, shapes)
In contrast to tracks, which are more like route recordings of routes that have been walked or driven, vectors are drawn lines or shapes (e.g. rectangles or polygons) that can be superimposed on a map. This requires data in the so-called GeoJSON format.
The TYPO3 map plugin (actually) includes a function to draw such vector shapes itself. However, this does not work reliably. Instead, an external GeoJSON editor such as the one mentioned here can be used, from which shapes drawn there can then be exported as GeoJSON files, here are two free options for this:
Map marker: Hide routing information
Normally, routing information is always supplied with an address that is displayed on a map using a marker. However, this can be undesirable in certain cases, which is why the routing information can also be hidden.
To hide the routing information in a TYPO3 element of type OpenStreetMap, assign the CSS class osm-ohnerouting to this element in its [Appearance] tab.
Saturation of the maps
If the colours of the maps are too strong - e.g. if you want the markers on them to stand out more clearly - you can tone down the colours to a completely greyscale display. This is done by assigning one of the following CSS classes to the relevant OpenStreetMap element in the [Appearance] tab:
osm-sat5- Reduce colour saturation to 50 percentosm-sat0- Remove colour saturation completely ⇒ Greyscale