Module 7.1: The colouring of flames
Flame colouring worksheet
-
 Flame colouring worksheet On this worksheet you will find the instructions for the flame colouring experiment.

Module 7.1: The colouring of flames
Light and colour
You've probably held a CD or DVD in your hand before, but have you ever taken a close look at it?
Task 7.1.1
Take a CD or DVD and hold the underside up to the light, turn it round and round.
Describe your observations.
Back of a DVD in sunlight

You can see a natural phenomenon on this DVD that is similar to the rainbow. On a CD or DVD, the light is broken down into its colours by diffraction on the special surface. In the case of a rainbow, this happens through the refraction of light in raindrops.
DVD-Oberfläche und Lichtbrechung im Regentropfen
Dieses Bild zeigt die Oberfläche einer DVD. Diese ist aus vielen kleinen aufeinanderfolgenden Furchen aufgebaut ist. Das Bild wurde mit einem Rasterkraftmikroskop aufgenommen.

Dieses Bild zeigt, wie weißes Sonnenlicht in einem Regentropfen gebrochen wird, sodass man alle Spektralfarben in einem Regenbogen sehen kann.

These phenomena show us one thing above all: sunlight as we know it is not simply "white light", but is made up of all the colours of the colour spectrum. We can characterise light physically and mathematically as a wave and describe the colours we perceive using their respective wavelengths. The visible range of light extends from violet light with a wavelength of around 400 nm to red light, which has a wavelength of up to 750 nm. Below 400 nm is the range of ultraviolet light (UV radiation), above around 750 nm is the range of infrared light.
However, there are also light sources that do not emit white light. You are probably familiar with examples such as neon tubes or fireworks, which can glow in many different colours.

.jpg)
Task 7.1.2
How can we investigate whether the light from such light sources is also composed of different colours?
To do this the experiment: Flame colouring. If you can't carry out the experiment at school, watch the video on the experiment as an alternative.
Then complete the following tasks:
- Describe your observations when you look at the flame without and with a hand spectroscope.
- Make an educated guess as to which element of the different salts causes the different colours of the flame.
- Judge whether you can explain these observations with the current atomic model.
The flame colouring experiment shows you a phenomenon that was already an unexplained phenomenon for natural scientists throughout the 19th century: when excited, the atoms of an element emit light at very specific wavelengths. Even if we only see a certain colour, this colour is a mixture of different light with very specific wavelengths.
The atoms are excited by supplying energy. In the case of flame colouring, this happens through the thermal energy of the gas burner. In fireworks, the glow is also triggered by thermal energy, in fluorescent tubes by electrical energy. The so-called emission spectra of the elements are visible through the hand spectroscope. The following figures show you the emission spectra of some elements (source of the spectra: Nino Čutić (2007)).
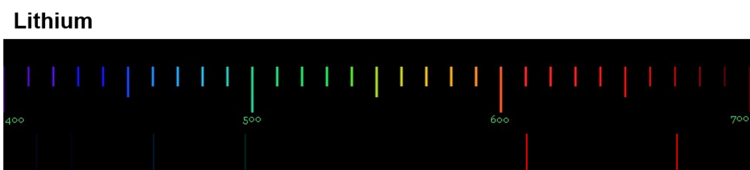
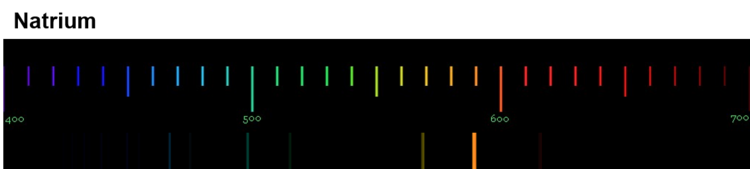
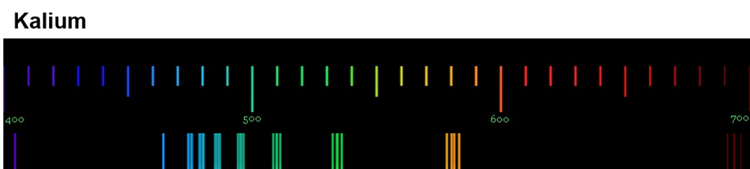
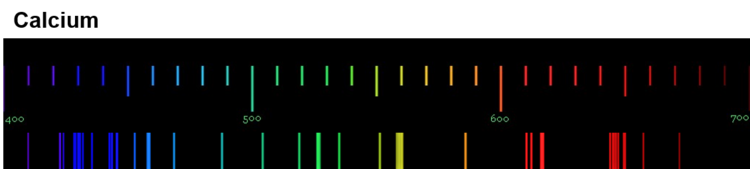
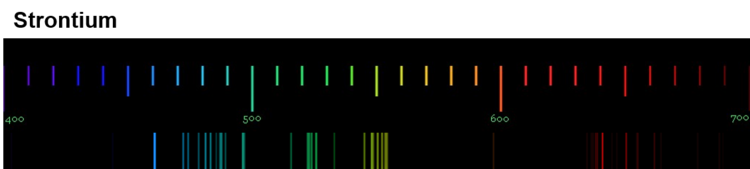
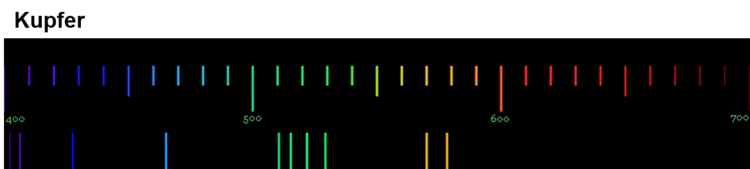
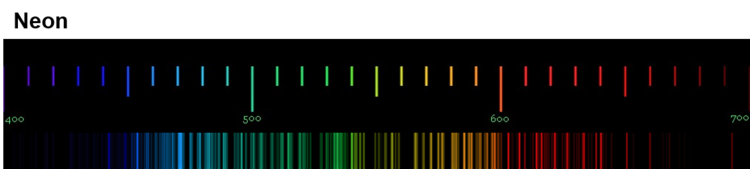
These spectra are something very special. The lines that an element shows in the emission spectrum are always the same and two elements never have the same spectrum.
So if these spectra are unique for each element, this means that the cause of this phenomenon must lie in the structure of the element's atoms! All atoms of an element must have something in common that distinguishes them from the atoms of other elements.
To be able to explain the origin of the emission spectra, you need to learn a little more about light and energy:
In 1905, Albert Einstein was able to show that the energy of light is dependent on its wavelength. Furthermore, this energy can only be absorbed and emitted in defined "portions", so-called energy quanta. This means that the light emitted by the elements has exactly the same energy that was previously absorbed by the atom.
This is very important for explaining the unique emission spectra: each line of a spectrum represents a very specific energy. And because each element has a unique spectrum, this means that each atom of a particular element can only absorb and emit very specific amounts of energy.
We can therefore say that the atoms of an element have energy levels.
However, we do not yet know how this absorption and release of energy takes place. That's what we want you to find out now.
Electrons can absorb and release energy
So far, we have visualised the atom as a sphere. We also know that the small, light electrons, the carriers of negative charge, are a building block of atoms.
We do not know how the electrons are distributed, but they are not firmly bound in the atom. You already learnt this in Building Block 3, when you were only able to charge things through friction. Einstein discovered that the electrons in atoms can absorb and release energy and thus "jump back and forth" between the so-called energy levels.
Now the question arises: How can we imagine these energy levels and how are the electrons actually distributed?
You can find the answer to this question in Building Block 7.3.
For interested parties
The emission spectrum of hydrogen was of particular interest to the scientists, as it is the element whose atoms have the simplest structure. They therefore hoped that they could explain the cause and laws of light emission using the hydrogen spectrum. The emission spectrum of hydrogen can be generated using a fluorescent tube filled with hydrogen gas. The spectrum of hydrogen consists of 4 lines in the visible range. Their wavelengths are from left to right: 410, 434, 486 and 656 nm.
The following figure shows you the emission spectrum of hydrogen.

Experimental recording of emission spectra
The following pictures show an example of an experimental setup for recording the emission spectrum of hydrogen and the final result. A hydrogen lamp, an optical slit, an optical grating and a simple screen with bleached paper were used. Note that due to the experimental set-up, the longer wavelength red light appears on the left of the screen and not on the right, as above. In addition, the distances between the lines should not be arranged on a scale, as above.
To record the spectrum, it is advisable to completely darken the room and use a camera with automatic exposure time setting. Modern smartphones are also suitable for this.
The Max Planck Institute for Plasma Physics provides instructions for building a mobile phone spectrometer on its website.


Calculating the energy of light
Einstein was able to derive a formula that describes the relationship between wavelength and energy. He was awarded the Nobel Prize in Physics in 1921 for this work. You can see the formula here:
\(E= \frac{\left(h\cdot c\right)}{\lambda}\)
with the Planck constant h = 6.626 - 10-34 J - s
the speed of light in a vacuum c = 299,792,458 \({m \over s}\)
and the wavelength λ in metres
Using this formula, we can therefore calculate the energy that defines the light of a specific line of an emission spectrum.
The following energy values resultfor the 4 lines of the hydrogen spectrum:
Wavelength [nm] | Energy of the light [eV] |
656 | 1,89 |
486 | 2,55 |
434 | 2,86 |
410 | 3,02 |
Note: The unit electronvolt [eV] is the "handy" unit of energy when very small amounts of energy need to be specified. 1 eV corresponds to 1.602 - 10-19 J - s
If hydrogen atoms emit red light with a wavelength of 656 nm, they emit an amount of energy of 1.89 eV. If they emit blue light with a wavelength of 434 nm, they emit 2.86 eV of energy. The atoms must have absorbed this energy beforehand.